Asians, Pacific Islanders fastest growing groups in Orange County, California
 • Rapid rise in number of unemployed and poor Asian Americans and Pacific Islanders accompany population growth, says new report
• Record numbers of Asian Americans and Native Hawaiians and Pacific Islanders are registering to vote and casting ballots
ORANGE COUNTY, California – Already home to the third-largest Asian American concentration in the United States, Orange County also has Asian Americans and Pacific Islanders as its fastest-growing populations, according to a new report released July 8.
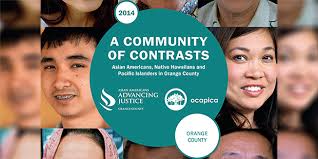
“A Community of Contrasts: Asian Americans, Native Hawaiians and Pacific Islanders in Orange County,” by Asian Americans Advancing Justice – Orange County and the Orange County Asian and Pacific Islander Community Alliance (OCAPICA), also notes that Asian Americans are experiencing dramatic growth in the number of unemployed and poor.
While Asian American and Pacific Islander-owned businesses in Orange County have created over 96,000 jobs and stimulated economic growth, U.S. Census Bureau data also show that the number of unemployed Asian Americans countywide grew 123 percent from 2007 to 2011.
The number of Asian Americans living in poverty increased 51 percent over the same period.
“Some see our communities as model minorities, yet these data show that the county’s Asian Americans and Pacific Islanders have been hurt by the economic crisis and have real needs,” said Mary Anne Foo, executive director of the OCAPICA. “Many of us are struggling, yet remain invisible to policy makers.”
The report finds that Native Hawaiians and Pacific Islanders (NHPI) in Orange County face particular challenges. Data from the California Department of Education show that students from these communities are both less likely to graduate from high school and to have completed the required courses for college admission.
Among adults, only Latinos are less likely than Samoan Americans to have a college degree. Data from the California Department of Public Health show that Native Hawaiians and Pacific Islanders have a death rate higher than all other racial groups countywide.
“This report shows that education and health are critical issues in Pacific Islander communities,” said Tana Lepule, executive director of Empowering Pacific Islander Communities (EPIC). “Without access to data on Pacific Islanders separate from Asian Americans, we wouldn’t be able to demonstrate our communities’ considerable needs.”
According to the 2010 Census, there are nearly 600,000 Asian Americans and over 19,000 Native Hawaiians and Pacific Islanders in Orange County; only Los Angeles and Santa Clara Counties are home to more Asian Americans nationwide.
One out of every five residents countywide is Asian American or Native Hawaiian and Pacific Islander. Between 2000 and 2010, Asian American and Native Hawaiian and Pacific Islander populations in Orange County grew 41 percent and 17percent, respectively, faster than any other racial groups. In contrast, the county’s total population grew only 6 percent over the same period.
“Asian American and Pacific Islander communities in Orange County have reached a critical mass,” said Stewart Kwoh, president and executive director of Asian Americans Advancing Justice – Los Angeles and its satellite office in Orange County. “Policy makers must address our growing needs as we become increasingly engaged in the political process.”
Record numbers of Asian Americans and Native Hawaiians and Pacific Islanders in Orange Country are registering to vote and casting ballots; nearly 230,000 Asian Americans were registered to vote countywide as of the 2012 General Election.
While Asian Americans made up 14 percent of the county’s voters during that election, they make up 25 percent or more of those old enough to vote in several legislative districts, including State Assembly Districts 72, 55, and 65, State Senate District 29, and Congressional District 39.


