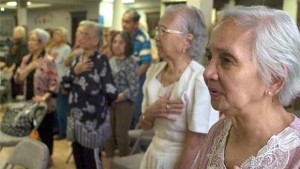
SAN JOSE, California — Filipino Americans aged 50 and over in San Francisco, Los Angeles and New York areas have 90 percent health insurance coverage
Fil-Ams are second only to Japanese Americans (96 percent) and rate more in healthcare coverage
The study is significant because “Asian-Americans and Pacific Islanders are the fastest growing racial group in the U.S.,” AARP Vice President of Multicultural Markets and Engagement, Daphne Kwok, said “And yet, the (AAPI) communities are understudied and underserved.”
The problem with assessing AAPI health insurance
High cost of insurance
The study noted that most Chinese Americans and Filipino Americans acquired their health insurance coverage through their employer and employee unions, still the primary vehicles for coverage.
Because of the high cost of coverage, the study said, 20 percent of AAPIs aged 50-64 are uninsured, compared with 15 percent of the same age group in the general U.S. population. And six percent of AAPIs aged 65 and over are uninsured, against one percent of the same in the general U.S. population. Only 33 percent of AAPIs aged 65 and over have private insurance
The study noted that while many AAPIs can’t afford health insurance
The report attributed this to most AAPI households being generally larger and multi-generational. The report listed AAPI 50 years and over household spending at $60,466 as against African-American (at $35,013) and Latino (at $38,693).
It also revealed that 76 percent of AAPIs 50 years and older owned their homes, compared with 63 percent amng African Americans and 62 percent among Latinos.
In household incomes for AAPIs 65 years and over, Filipinos are on top of the list at $53,831, followed by the Japanese ($43,824), Tongans ((42,328), Indonesians ($38,214) and the general U.S. population ($33,906).
Yet, of AAPIs aged 65 and over who are below the poverty level, Filipinos at seven percent are just below the general U.S. population at 9.5 percent, but above the Japanese at 6.2 percent.
More obstacles
The study also said lack of familiarity with the U.S. health care
Acculturation was also pointed out as a factor. Many AAPIs 50 and older who immigrated to the U.S. may have retained original cultural values and do not have English proficiency. It is estimated that two-thirds of AAPIs are immigrants.
The study pointed out: “Asian Indians may prefer home treatments. Chinese Americans may practice more traditional Chinese medicine like acupuncture. Filipino Americans may believe in the relationship between good health and the balance of hot and cold. Korean Americans have the concept of ‘hanyak’ while Southeast Asians may subscribe to traditional Buddhist health practices.”
The study revealed that among Filipino Americans, the most commonly reported health problems are: cancer, cardiovascular disease, diabetes
AAPIs provide best elderly care
The AARP study also said that 54 percent of AAPIs are most likely to talk about the caregiving of their elders to doctors or health providers
The study also pointed out that “AAPI families are resistant to place their elders in institutional facilities. In their traditional culture, Asian Indians even go further by resisting home visits from healthcare providers because they would rather seek help from family and friends. Traditional Pacific Islanders show preference to being cared for by family during illness rather than going to a doctor.”
“Among Chinese Americans, there is reluctance to discuss end of life related issues because of karma, the belief that mentioning something bad can make it happen,” the study said. “Caregivers with similar ethnicity and language may be desired by those who receive care, as was reported among older and less acculturated Japanese-American adults.”
The study added, “Filipino Americans may move from one child’s home to another to take care of grandchildren, while they themselves would be cared for later by their children. Housing alternatives provided by the community and the church are seen among Korean Americans.”
Like us on Facebook
